One of the most important aspects of data management is easily visualizing data points streaming from devices. However, the inability to explore historical data and generate graphs has always been missing – until now.
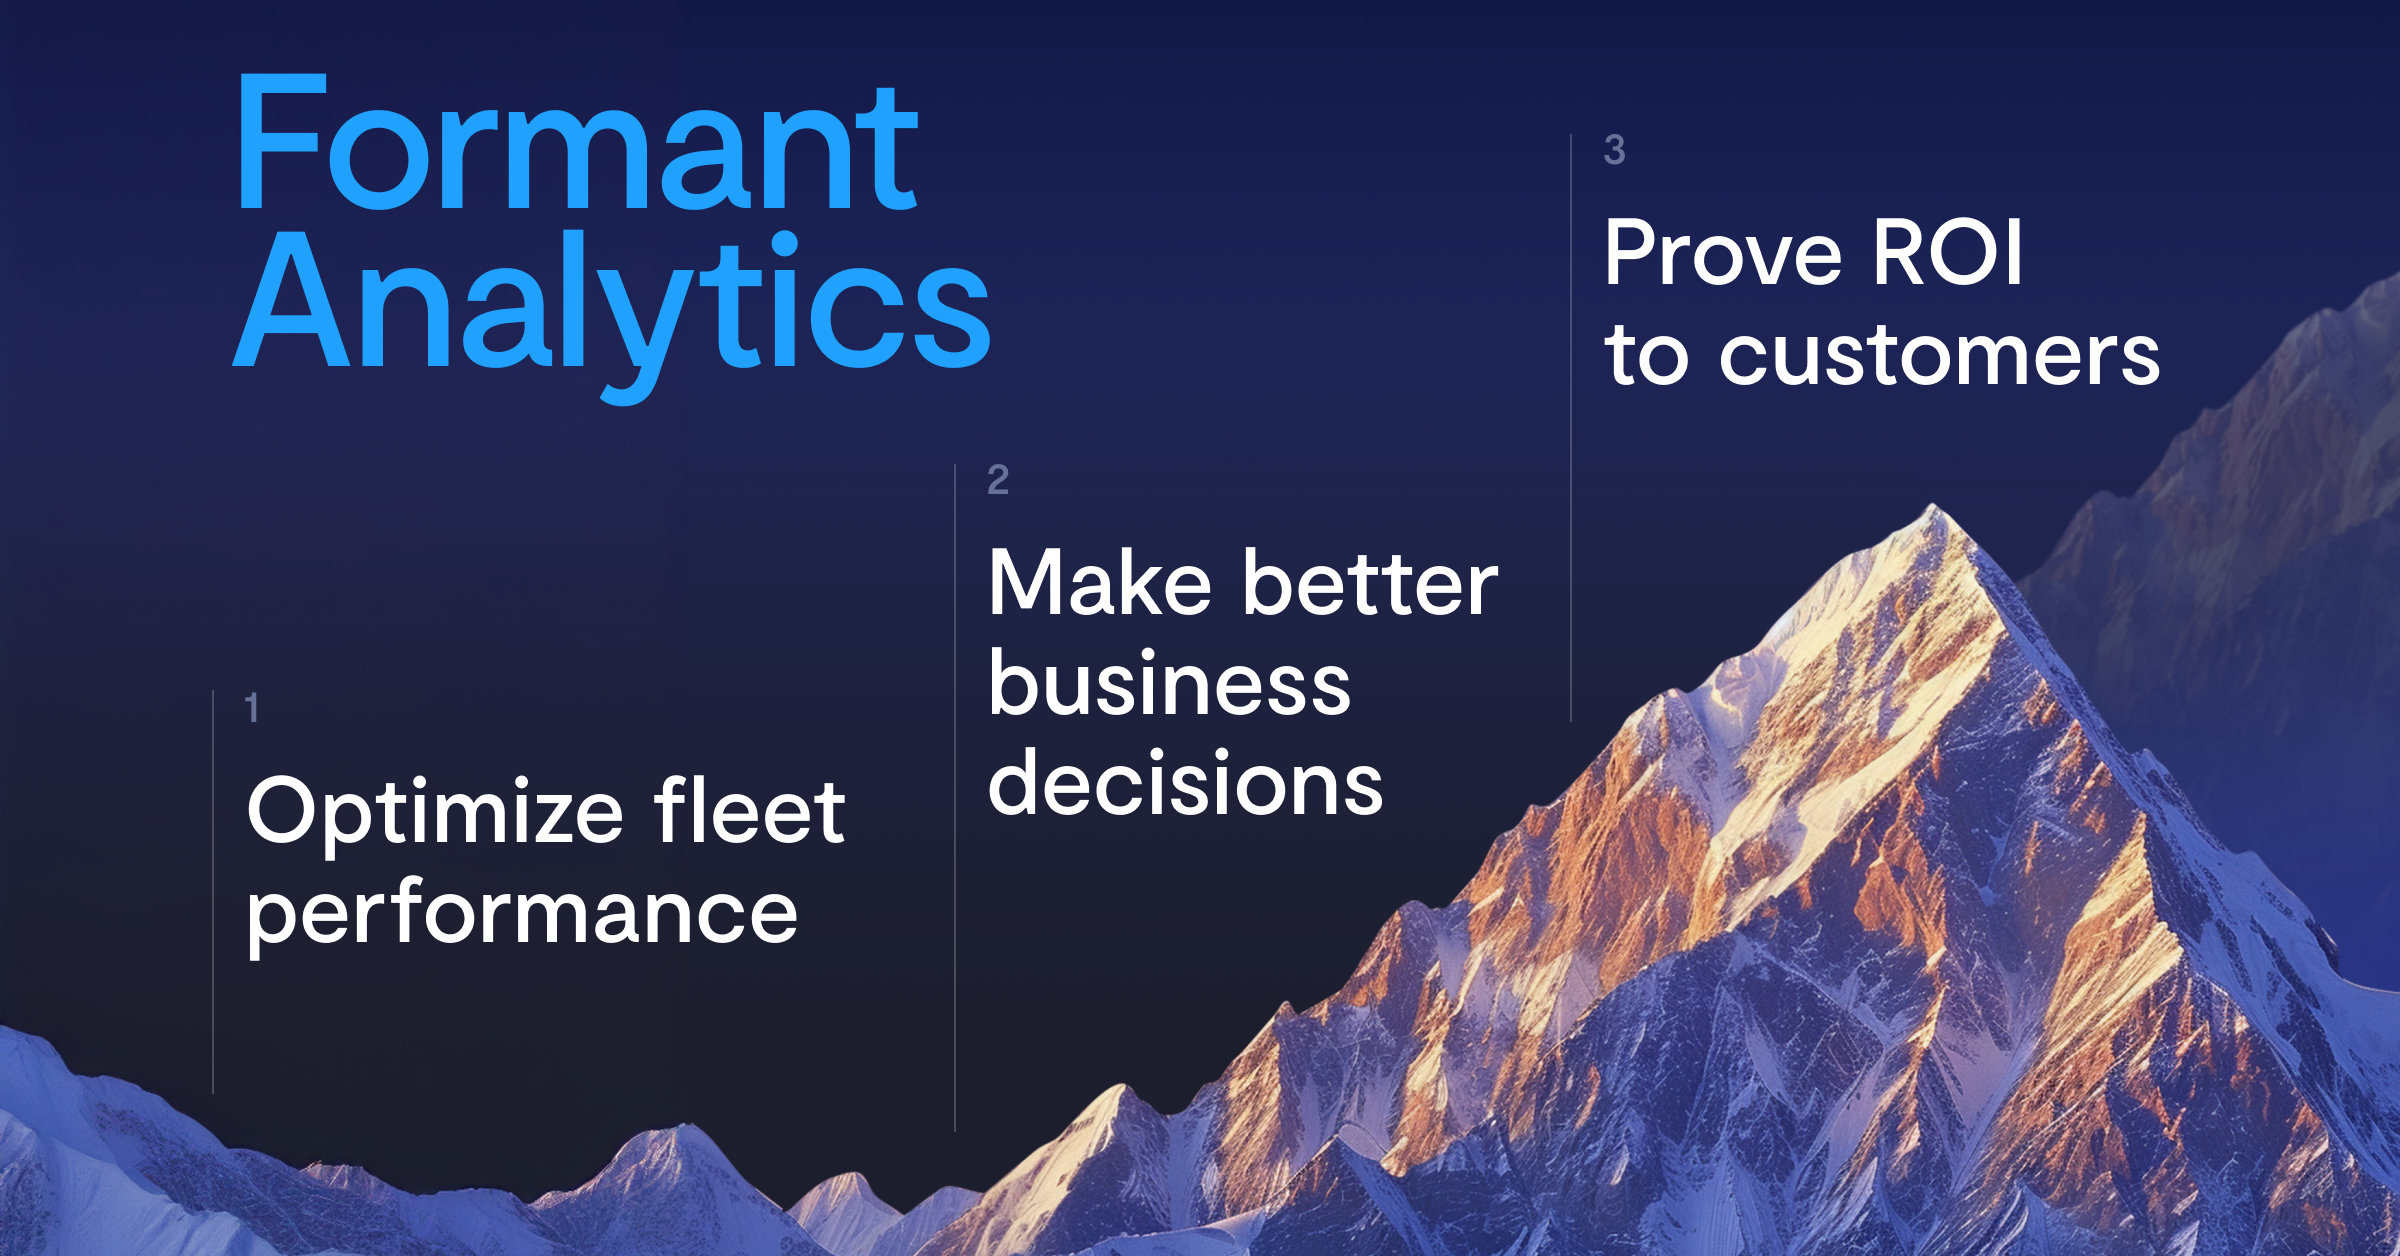
We are excited to announce Formant Analytics, which enables robotics companies and integrators to reduce operations costs by uncovering performance trends and optimizing operations, which all lead to proving ROI to customers. Plus, with the power of AI, users can now gain insights with a simple request easily; everyone from engineers to business executives can use Formant Analytics to get the most out of their data.
Formant Analytics allows users to get insights on their data via a simple “point and click” interface. After choosing a readily available stream (such as robot battery level), a user can choose one of seven different visualization types to plot their data on:
- Line chart
- Bar chart
- Pie chart
- Scatter plot
- Summary (card visualization)
- Table
- JSON viewer
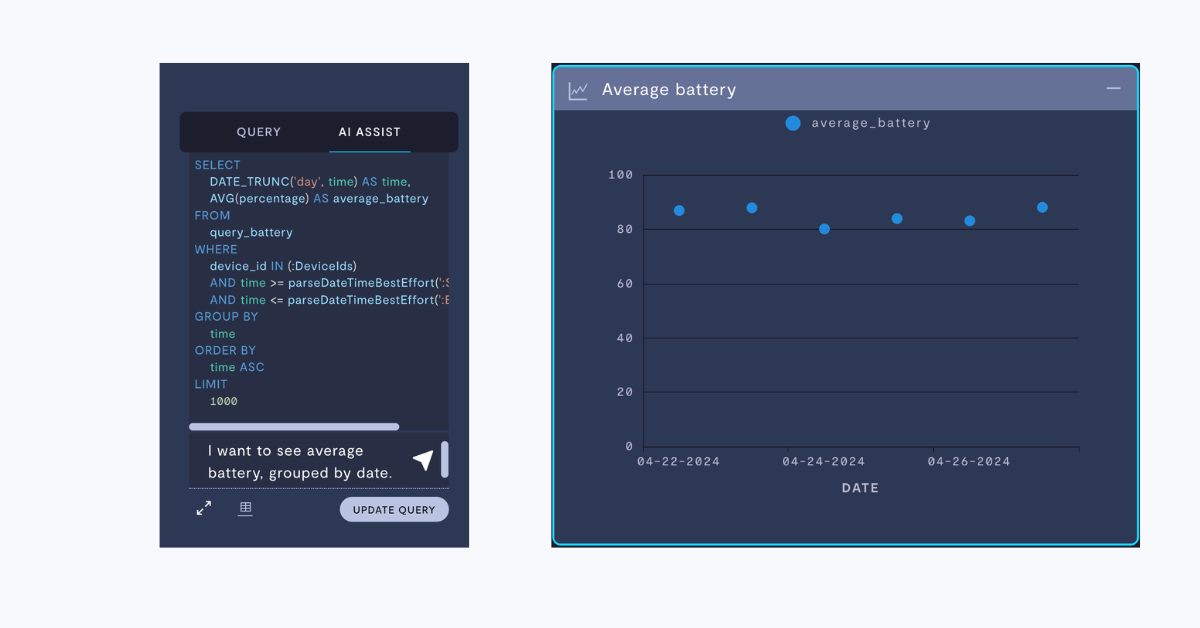
Additionally, users needing more in-depth analytics can utilize Advanced mode. In this mode, they can either write their own SQL queries, or utilize Formant’s AI-based SQL generator. This AI-based functionality allows a user to submit a plain-text prompt and have the proper SQL query written for them, all at the click of a button.
 Let’s take a closer look at how users can utilize Formant Analytics in their everyday operations.
Optimize fleet performance
Robotics companies need to ensure their fleets are performing as efficiently as possible. With Formant Analytics, our users have the ability to delve into everyday operations and analyze performance metrics easily.
All stream and event data ingested into Formant can be leveraged by Formant Analytics to evaluate robot performance. Analytics views can be aggregated across a fleet of robots to understand performance beyond the individual device. As many robotics companies have fleets operating across multiple environments, utilizing Analytics to compare performance in different climates or predict maintenance by tracking performance can support product improvements and client satisfaction.
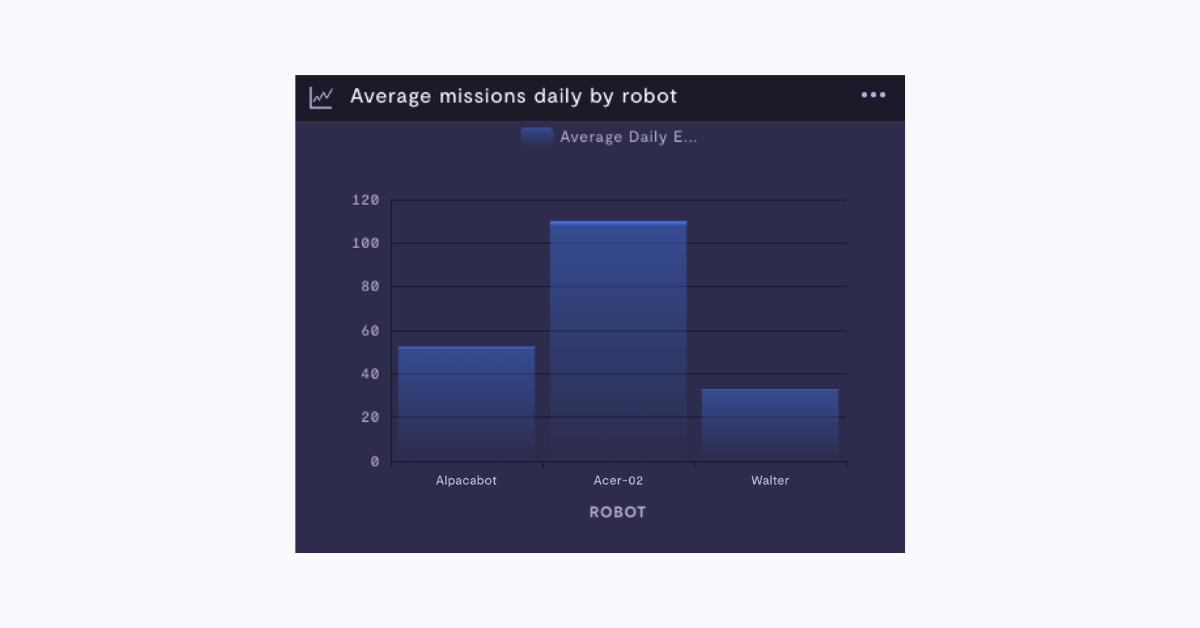
One customer is utilizing Formant Analytics to understand how many times, on average, each one of their robots completes a mission on a daily basis. By comparing the daily average mission count, they are able to understand how while each one of their robots are comparatively performing in their respective environments and missions:
In another example, consider a fleet of warehouse robots operating in regions with varying humidity levels. By analyzing data on how humidity affects sensor accuracy or battery life, Formant Analytics could help pinpoint that robots in more humid regions might require more frequent sensor calibrations or battery replacements. With this insight, operational managers can schedule preventive maintenance more effectively, reducing downtime and improving the overall efficiency of the fleet.
Make better business decisions
When businesses need to make decisions around automation, data-backed metrics can assist in making the right moves. Every robotics company needs to help their customers make plans around current operations and future scaling of fleets.
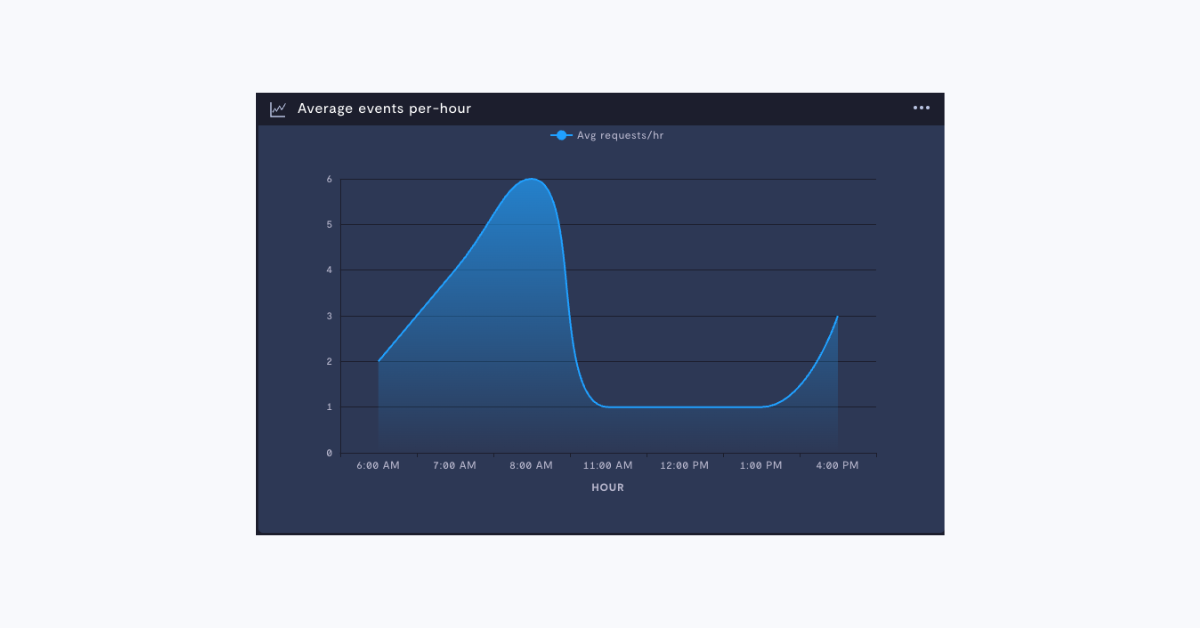
Analyzing customer usage provides beneficial insights for vendors and system integrators to see which environments their robots are utilized most and report individual trends back to each customer based on their usage. One customer using Formant Analytics has built multiple analytics visualizations showing staff allocation to understand where they are understaffed at various times, throughout the day, based on average response time. This customer has formatted the visualization as a bar chart to understand staffing gaps and are actively adjusting staffing based on this data (data anonymized for customer privacy):
 Additionally, this customer analyzes the per-person number of intervention responses and average time-to-respond to better understand where more employee training is needed across their staff. Based on identified trends, vendors can identify opportunities for upselling customers with solid, data-backed evidence. Analyzing performance metrics also provides an opportunity to dig into how efficient customer service efforts are and to track the success of scaling a deployment.
Prove ROI to customers
Return-on-investment (ROI) is one of the most vital metrics to prove when it comes to physical automation. Providing end customers with metrics on the ROI of their fleet helps them understand exactly how they’re improving efficiency and saving costs by using the robots being tracked in Formant.
Many customers are tracking robot ‘events,’ which correlate directly to return-on-investment metrics for their own customers. For instance, one company, using robots to perform repetitive agricultural tasks like picking crops, leverages Formant Analytics to measure productivity. By plotting data such as the number of crops harvested over specific intervals on line and bar graphs, the company can monitor performance trends. This allows them to improve operational efficiency and demonstrate the value of their services to their clients, ultimately ensuring consistent and optimized delivery.
End customers benefit from a system that tracks key performance indicators (KPIs), such as the average number of tasks completed per day against promised results or receiving monthly ROI summary reports. This allows them to compare current performance to historical data and calculate the ROI for their robotic systems.
By utilizing Analytics to demonstrate quantifiable improvements, users can prove to their customers that their fleet delivers a positive return. And with the ability to build customizable dashboards and monthly ROI reports, showcasing the value of robotic investments becomes easier than ever.
If you’d like to learn more about Analytics, request a demo with our team. You can also view our documentation for this feature.