As a VP of Engineering at a robotics company, one of the most important things you need to get right is data.
Data affects every department, and each one needs it for different reasons. From CFOs trying to understand the operating cost per robot, to operations focused on deployment times and mission achievements, and engineering monitoring individual mission performance, the insight data can provide is key to a robotic company’s success. Therefore, it’s crucial that companies collect the data they need and have a realistic plan for accessing that data across departments.
At Formant, data is an integral part of our platform and the value we bring to scaling robotics companies, but historically we haven’t always been spot on in our approach to surfacing that data to our users.
History of Formant Data- where we went wrong
When we first approached the challenge of visualizing large sets of Formant data, we thought we knew what our customers wanted. They were sitting on treasure troves of data ingested by Formant, and they wanted a way to analyze that data and visualize trends.
Our response was to build a new feature called Formant Analyze, which was essentially an embedded enterprise-grade BI tool that was rigid and complicated.
This solution had a number of downsides:
- It required users to use proprietary query language, such as LookML instead of SQL, which essentially meant we had to write queries for our customers in order to get the most out of the data
- There was no easy way to export that data to another tool such as Tableau or Grafana
- The onus of creating visualization types fell entirely on Formant due to the high bar for customers to write their own queries
The need for flexible data integration and management first began with one specific customer.
To be able to learn from their data, this customer wanted to export it to Grafana, a tool we weren’t connected to natively. First, we built custom embedded Looker dashboards to fulfill this need. However, this meant Formant needed to write many queries and develop visualizations for them any time they wanted to build a dashboard or dive deeper, which became time-consuming and delayed the sharing of information.
In an effort to reduce reliance on us to write queries, we built dashboards to support queries but found each of these ran into issues as well, leading us to the clear conclusion: customers should be able to make their own choices when it comes to their data and front-end BI tool.
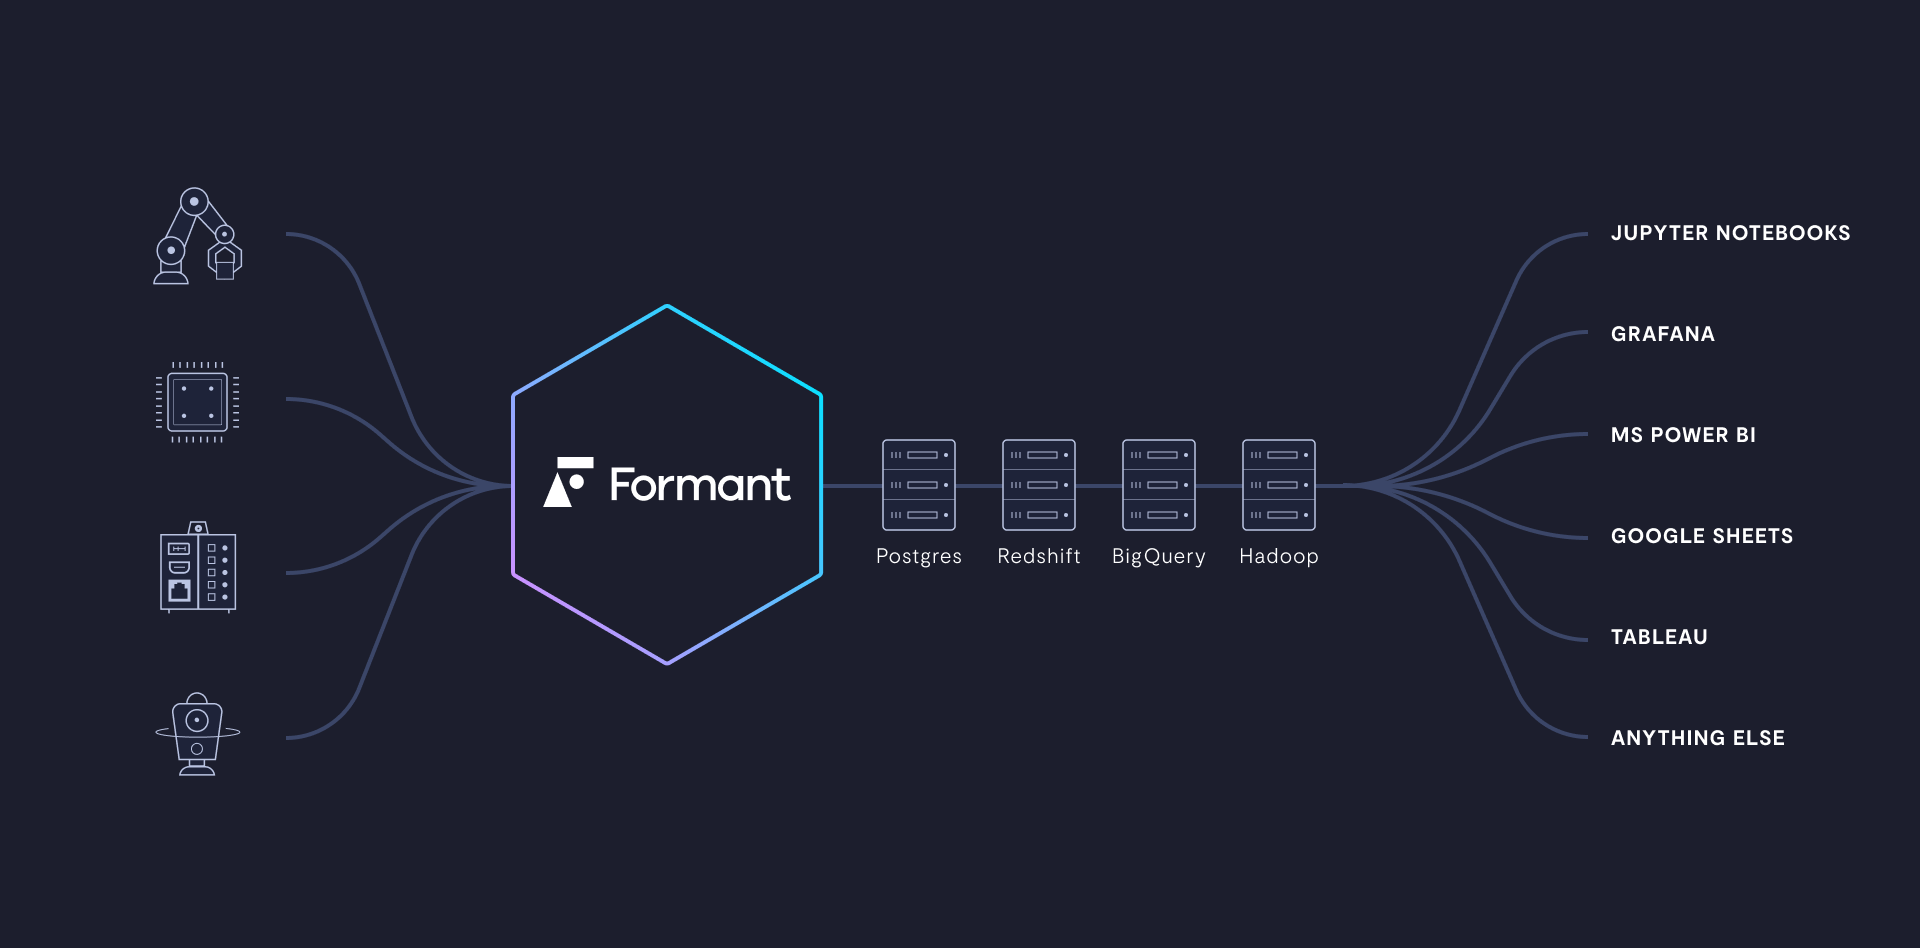
Being that data is so crucial to robotics companies, as a platform we didn’t want to dictate its movement. Instead, like any other good data pipeline, we decided to give users the power to determine where data went and how it was consumed.
By providing users with the ability to choose the right tool for the job, Formant was able to provide the data flexibility necessary to help them quickly solve problems with as few obstacles as possible.
Companies need data flexibility to operate and optimize on their own terms
To help customers solve issues and learn from data as quickly as possible (using tools that they are most familiar with), we ensure it’s incredibly easy to hook up their data pipes, then we simply get out of the way.
There are all types of questions scaling robotics companies have that easily accessible data can help answer- particularly in regards to analytics. For example:
- How can we detect anomalies in battery voltage, uptime, “unplanned assists” or mission hours or distance traveled?
- How can we expose the efficiency and value that the robot provides to end customers/users?
- How many hours are customers using the robot? Out of those hours, are they being used autonomously or how often is it in manual mode?
But it’s not just about analytics. There’s also a need for harmonized data management to help operations and the business run smoothly- the future success of the company depends on it. Users need to be able to integrate data into their task management systems (such as Jira), billing systems (such as Stripe), and other business tools so that data can be stored and sent anywhere, anytime it’s needed; even if it’s a few years down the road.
Having data at their fingertips to export to any tool enables companies to better answer a variety of questions and solve issues regarding their operations. What’s more, data flexibility allows for more freedom to solve these issues.
Some problems, however, can’t be answered with just one data point- they require joining multiple tables of millions of points of data, which is something that isn’t possible to do within an operations platform itself. By enabling users to export their data to any tool, that data can be combined with other contextual data (including internal non-robot data), to provide answers.
More than just destinations
In addition to locations, there are key personas that need access to exported data as well to support their departments.
Business personas, such as the executive team and business analysts need data to understand trends to attempt to correlate usage to billing or monitoring onboarding for new customer deployments. They also need to search through BI dashboards or excel/Google sheets so they can further dive into details.
Some of the most obvious personas that need access to data are data scientists, developers, and roboticists. These roles typically want data within their tool in their preferred format, such as Jupyter Notebooks or logz.io, to gain a better understanding of the data, debug an issue, or optimize their autonomy.
Serving as the first line of defense, tech support also needs data to provide efficient responses to customers and improve the uptime of the robot.
Formant provides a default visual for these personas but also allows the chance to customize or expose these visuals to their in-house tools.
Data warehouses vs data lakes: why it matters
Data can exist in a variety of locations; typically, they’ll live in either a data warehouse or data lake, which serve separate purposes based on how much the data is needed.
Data lakes store the raw data in which the data’s purpose has not yet been determined. Data warehouses can be specific to the department’s needs, as the data has been filtered and structured for a specific purpose.
Most robotics companies will use a specific cloud provider (AWS, GCP, MS Azure, etc.) and prefer to store their data in data lakes within those providers. Storing data within a data lake is also preferable because it is much cheaper than storing it in a more structured data warehouse. This allows for more affordable storage of data so that personas can load only the data they need for analytics purposes into a more expensive data warehouse.
Data finally goes where it needs to go
To solve issues quickly and hold up against tough competition in the robotics industry, full access to data is vital. Formant gives users the chance to distribute their data to any tool needed, expediting the time it takes to answer questions and optimize their product through data flexibility.
We believe that robots-as-a-service (RaaS) company tech stacks shouldn’t be monolithic, and our goal as a data platform is to avoid being overly prescriptive in the tools we offer to get the job done. By introducing data flexibility in place of embedded analytics, we created an incredible value for our end customers and their users. This came about by listening to our users, and we couldn’t be more excited to continue our education as we evolve alongside the needs of the robotics industry.


